Alternative Text and Accessibility
Table of Contents
Accessibility in publishing is an approach to content design whereby articles and other texts are made available in alternative formats designed to aid or replace the reading process. This is most commonly used to make content accessible for users with a visual impairment or print disability. Taylor & Francis is committed to improving the accessibility of the content that we publish online. A major component of publishing accessible content is ensuring that all images have text that describes the image. This text that describes images, which is generally known as alternative text or “alt text”, helps people who are not able to see the images, who may be relying on screen reader software, and also helps to make images more discoverable in search.
Note for prepress suppliers: Alternative text may be provided by the author either as part of the original manuscript files or during the proofing process. When alternative text is present it should be tagged using an <alt-text> or <long-desc> element. At this time, Taylor & Francis does not require prepress suppliers to generate alternative text. Taylor & Francis is currently running a pilot project in which authors are asked to provide alt text for figures.
Image descriptions in <alt-text> or <long-desc> should have attribution metadata to identify its source, which may be different than the authors of the article. In publishing workflows, image descriptions for accessibility might be provided by an author, publisher, or vendor, and generative AI may be used in the creation of image descriptions. See Attribution Metadata for more information.
The <alt-text> (alternate text) element contains a short description, textual name, or purpose-statement for a structure such as a figure, table, graphic, math formula, other object. The element is typically used by systems such as pronouncing screen readers to make the object accessible to people or systems that cannot read/see/display the object. The alternative text should be short, typically 25 - 30 words (although this is not a hard limit), because alt text that is unnecessarily long creates a burden for users who rely on screen readers.
The <long-desc> (long description) element contains full description or summary of the content for a structure such as a figure, table, graphic, math formula, other object. The <long-desc> element differs from the <alt-text> element in both length and purpose. The <alt-text> is typically very short and meant for quick scan reading by a screen reader or showing as words behind a graphic. The <long-desc> is meant for an extended description of an object such as a figure, table, graphic, etc., for example, a textual summary of a pie chart that explains both the visual form of the chart and significance of the information that is presented visually.
<alt-text> and <long-desc> are not to be used as a replacement for <caption>, which is a visual element typically displayed alongside a figure, table, etc. The text within <alt-text> and <long-desc> should not duplicate the text within <caption>.
Schematron validation is used to ensure that <alt-text> and <long-desc> adhere to certain rules, which are as follows.
The text within <alt-text> and <long-desc> should conclude with a full-stop/period, which allows for a pause in the screen reader before it continues on to the next body of text.
There should normally not be more than one <alt-text> and one <long-desc> within an object (figure, table, graphic, etc.). In cases where alt text is provided in more than one language, each alternative language version should be tagged in its own <alt-text> or <long-desc> element each with an xml:lang attribute with a value that identifies the language. JATS supports alt text in multiple languages by allowing an object (such as a figure or table) to have more than one <alt-text> or <long-desc> element each with an xml:lang attribute to identify the language of the text.
Alternative text that is longer than 130 words should be tagged using the <long-desc> element instead of the <alt-text> element.
The text within <alt-text> and <long-desc> should be at least 5 words in length. Alt text that is too short is probably an error or does not convey enough information about an image to the user.
Errors in transcription from author manuscripts into XML might result in variations of the phrase “alt text” or “alternate text” appearing in alt text or a caption. It is redundant for alt text to be labeled as alt text within the <alt-text> or <long-desc> elements, and it is incorrect tagging if alt text is placed inside a <caption> element instead of in the <alt-text> or <long-desc> elements.
Errors in transcription from author manuscripts into XML might result in a label (such as “Figure 1” or “Table 1”) appearing in alt text. It is redundant for the label to be duplicated in the <alt-text> or <long-desc> elements.
Alt text that repeats surrounding text creates redundancy for users who rely on screen readers. There should not be duplication between alt text and the title or caption of an figure or table.
When two or more images on a web page have the same alt text this is flagged as an error by accessibility checking software. Every image should have unique alt text that describes the image. If an image is used in more than one place the contextualized description of the image should be unique.
Tables should be tagged for accessibility by properly tagging all headings and by including alt text if alt text is provided. See the topic page on Tables for more information about tagging accessible tables.
Math should be tagged for accessibility by including MathML for each <display-formula> and <inline-formula>. Screen reader software can use MathML to provide automatic pronunciation for math. See the topic page on Math for more information about tagging math.
Inline images (except for those used for Math with alternative MathML) should include alternative text tagged in <alt-text> within <inline-graphic> if alt text is provided.
Some images are used as a visual decoration and are not intended to convey information. Decorative images may have “decorative.” as the alt text. Although alt text should be unique, it is a permitted exception for an article to have more than one image with “decorative.” as the alt text.
Note that the alt text should be concisely descriptive, NOT an echo of the caption.
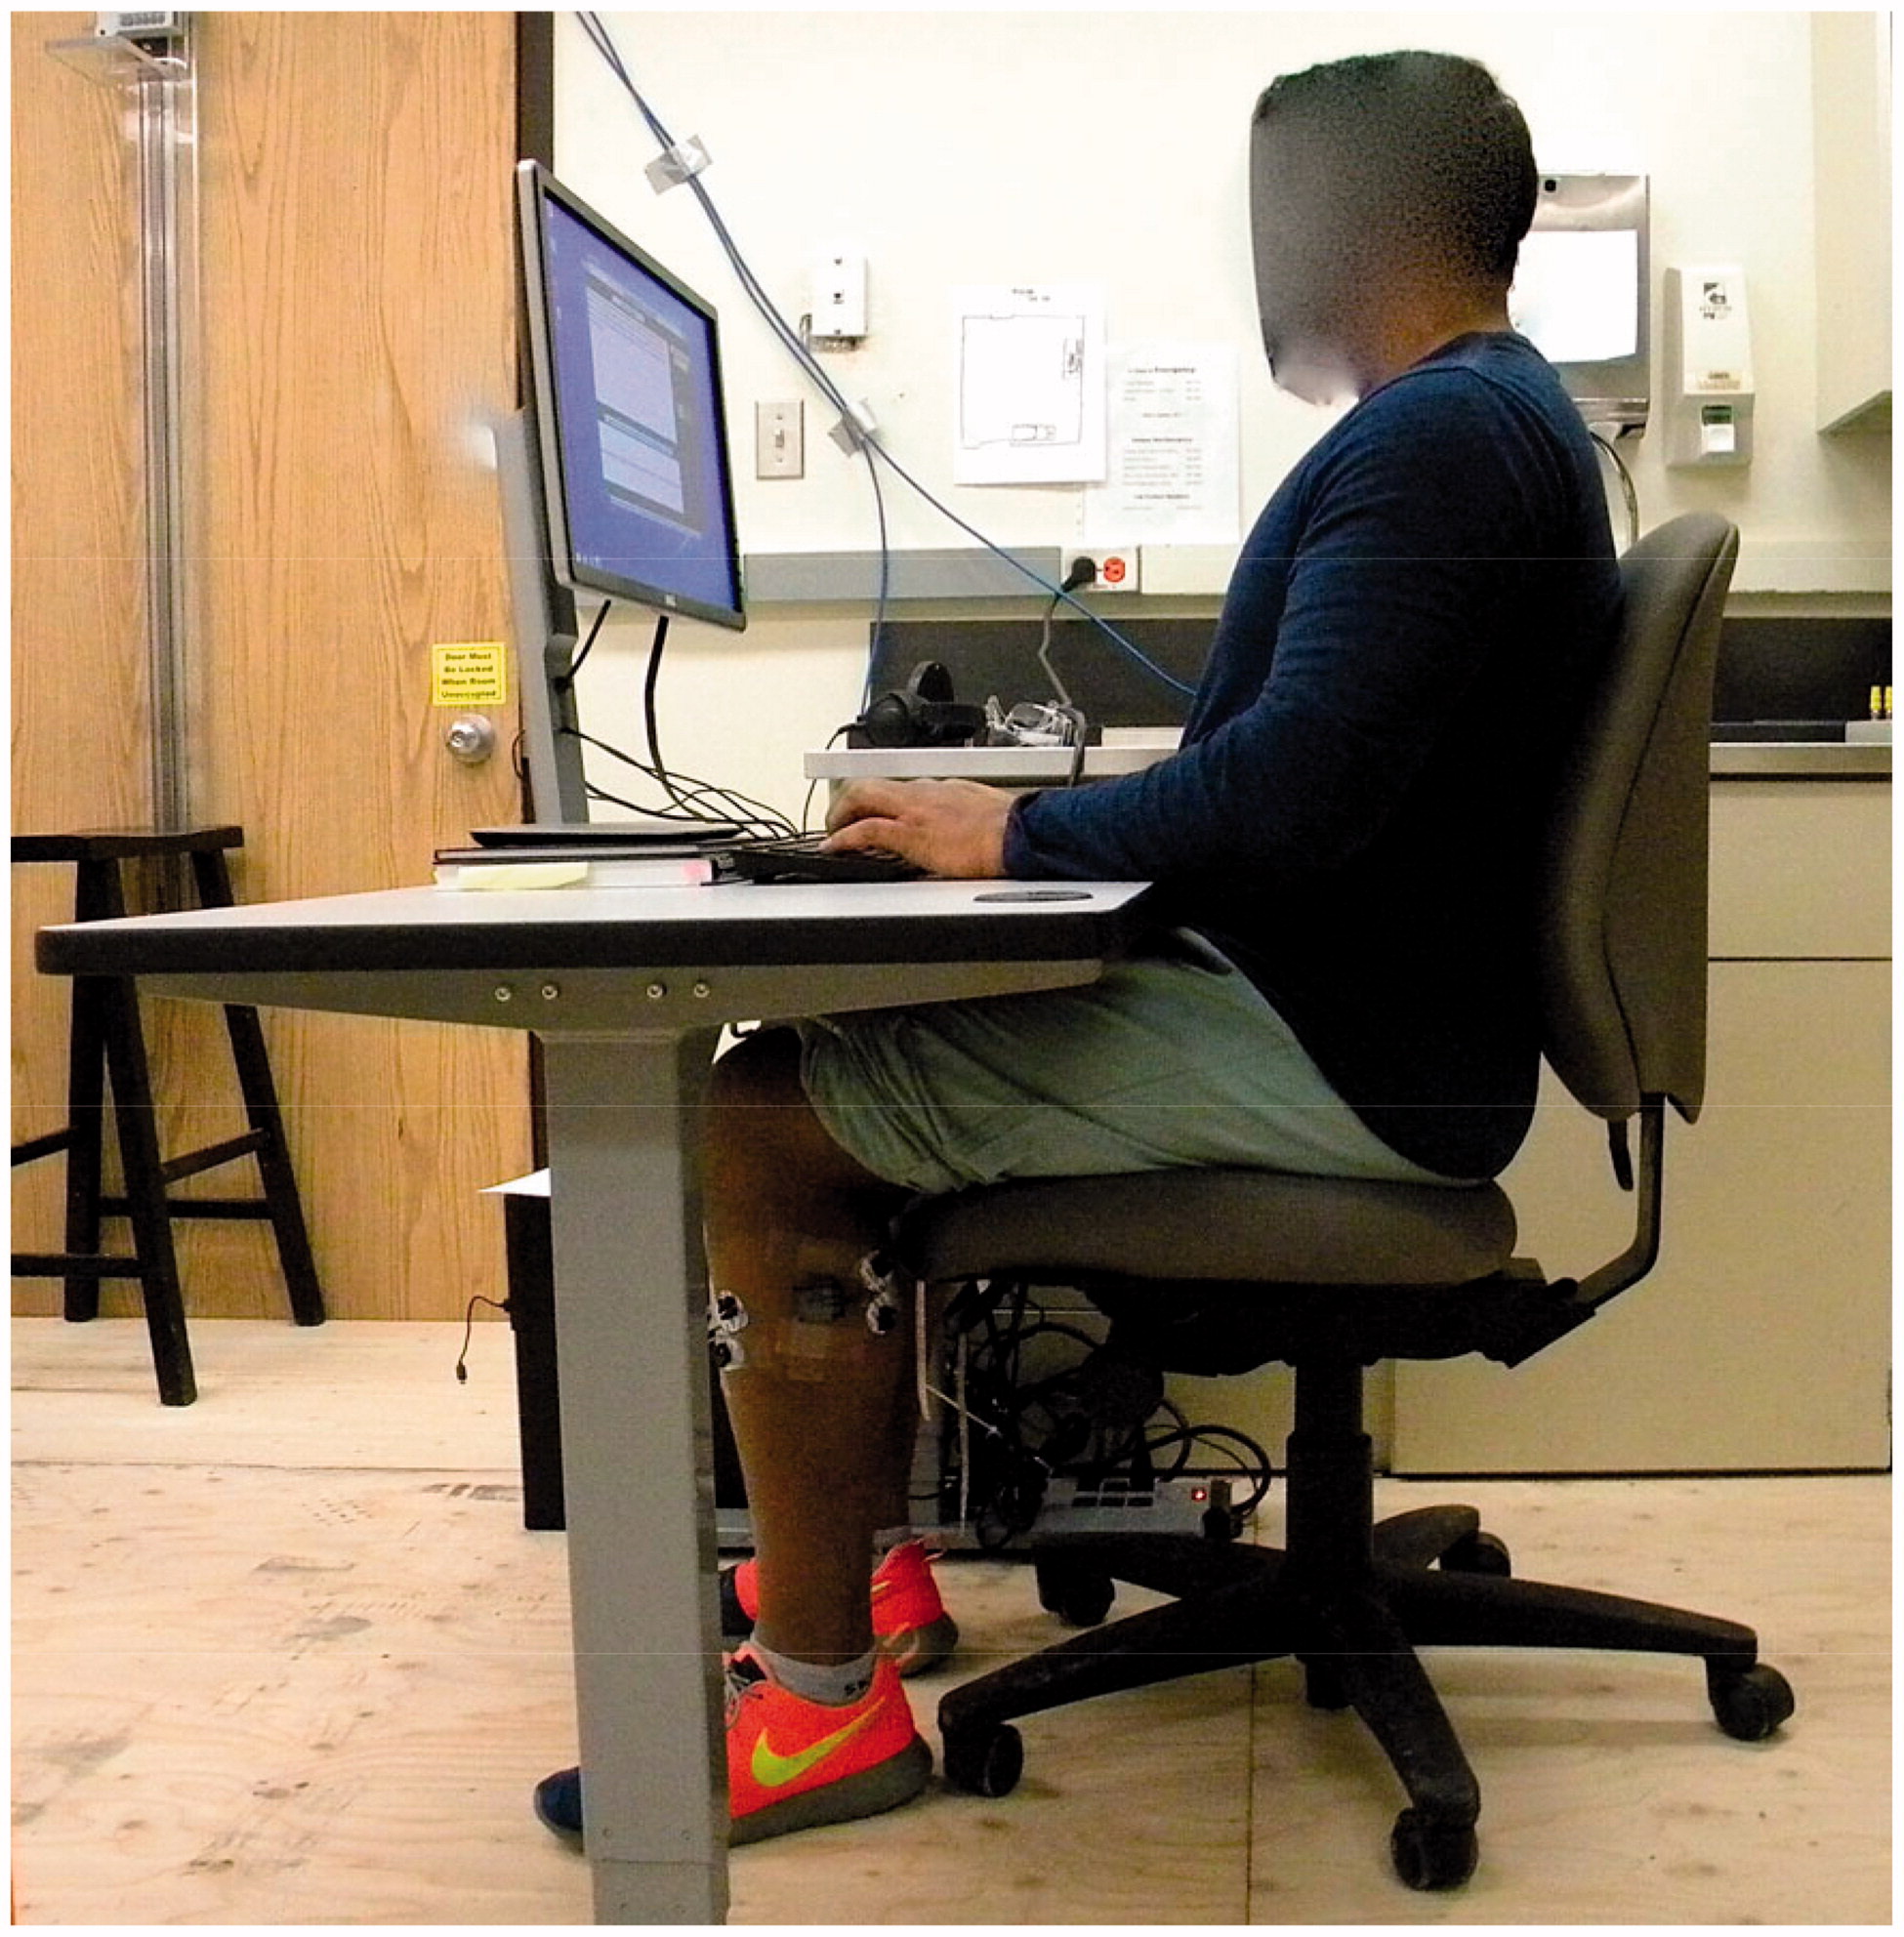
This example is from https://doi.org/10.1080/00140139.2021.1979660 (see image below).
<fig id="F0004">
    <label>Figure 4.</label>
    <caption>
    <p>Ergonomically adjusted workstation for the 2 hour sitting exposure. Chair, desk, and computer monitor heights were adjusted to each participant individually.</p>
    </caption>
    <alt-text>Side-view photograph of a participant sitting at a desk. The participant sits on a traditional office chair, looks straight ahead at a monitor placed in front of him, and types. Hip, knee, and elbow angles are at 90° or slightly more.</alt-text>
    <graphic xlink:href="TERG_A_1979660_F0004_C.jpg" content-type="color"/>
</fig>
TERG_A_1979660_F0004_C.jpg
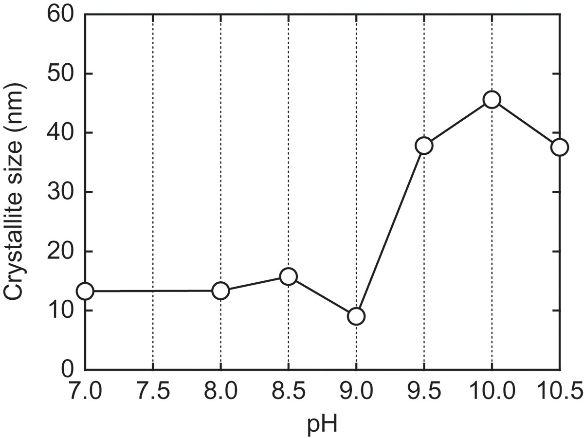
<alt-text> short description with a <long-desc> extended description of a graph (see image below).
<fig id="F0003">
<label>Figure 3.</label>
<caption>
<p>Influence of the pH value of the source solution on crystallite sizes.</p>
</caption>
<alt-text>A line chart showing that as pH value increases, so do crystallite sizes.</alt-text>
<long-desc>A line chart showing how pH value effects the source solution on crystallite sizes. The x axis shows the increasing pH value from 7.0 to 10.5, increasing in units of 0.5. The Y axis shows the Crystallite size in nm, from 0 to 60, increasing in units of 10. The line chart is steady between Ph levels 7.0-9.0, with Crystalline size at an average of 12nm. The chart shows a sharp increase between pH levels 9.0 and 10.5, spiking to 45nm.</long-desc>
<graphic xlink:href="TACE_A_1439692_F0003_B.png" content-type="black-white"/>
</fig>
TACE_A_1439692_F0003_B.png
This example is from https://doi.org/10.1080/10598650.2020.1771993 (see image below).
<table-wrap id="T0001" position="float" orientation="portrait">
<label>Table 1.</label>
<caption>
<title>Demographics of respondents.</title>
</caption>
<alt-text>Table showing the demographics of the survey participants in both frequency and percent. Participants were predominately female, aged 26–35, and Caucasian.</alt-text>
<oasis:table frame="topbot">
<oasis:tgroup cols="3">
<oasis:colspec colnum="1" colname="c1" colwidth="*"/>
<oasis:colspec colnum="2" colname="c2" colwidth="*"/>
<oasis:colspec colnum="3" colname="c3" colwidth="*"/>
<oasis:thead valign="bottom">
<oasis:row>
<oasis:entry colname="c1" align="left">Gender</oasis:entry>
<oasis:entry colname="c2" align="center"
>Frequency (<italic>n</italic> = 395)</oasis:entry>
<oasis:entry colname="c3" align="center">Percent</oasis:entry>
</oasis:row>
</oasis:thead>
<oasis:tbody>
<oasis:row>
<oasis:entry colname="c1" align="left">Male</oasis:entry>
<oasis:entry colname="c2" align="char" char=".">73</oasis:entry>
<oasis:entry colname="c3" align="char" char=".">18.5</oasis:entry>
</oasis:row>
<oasis:row>
<oasis:entry colname="c1" align="left">Female</oasis:entry>
<oasis:entry colname="c2" align="char" char=".">322</oasis:entry>
<oasis:entry colname="c3" align="char" char=".">81.5</oasis:entry>
</oasis:row>
</oasis:tbody>
</oasis:tgroup>
<oasis:tgroup cols="3">
<oasis:colspec colnum="1" colname="c1" colwidth="*"/>
<oasis:colspec colnum="2" colname="c2" colwidth="*"/>
<oasis:colspec colnum="3" colname="c3" colwidth="*"/>
<oasis:thead>
<oasis:row>
<oasis:entry colname="c1" align="left"><bold>Age</bold></oasis:entry>
<oasis:entry colname="c2" align="center"
>Frequency (<italic>n</italic> = 398)</oasis:entry>
<oasis:entry colname="c3" align="center">Percent</oasis:entry>
</oasis:row>
</oasis:thead>
<oasis:tbody>
<oasis:row>
<oasis:entry colname="c1" align="left">18–25</oasis:entry>
<oasis:entry colname="c2" align="char" char=".">56</oasis:entry>
<oasis:entry colname="c3" align="char" char=".">14.1</oasis:entry>
</oasis:row>
<oasis:row>
<oasis:entry colname="c1" align="left">26–35</oasis:entry>
<oasis:entry colname="c2" align="char" char=".">192</oasis:entry>
<oasis:entry colname="c3" align="char" char=".">48.2</oasis:entry>
</oasis:row>
<oasis:row>
<oasis:entry colname="c1" align="left">36–45</oasis:entry>
<oasis:entry colname="c2" align="char" char=".">83</oasis:entry>
<oasis:entry colname="c3" align="char" char=".">20.9</oasis:entry>
</oasis:row>
<oasis:row>
<oasis:entry colname="c1" align="left">46–55</oasis:entry>
<oasis:entry colname="c2" align="char" char=".">37</oasis:entry>
<oasis:entry colname="c3" align="char" char=".">9.3</oasis:entry>
</oasis:row>
<oasis:row>
<oasis:entry colname="c1" align="left">56–65</oasis:entry>
<oasis:entry colname="c2" align="char" char=".">21</oasis:entry>
<oasis:entry colname="c3" align="char" char=".">5.3</oasis:entry>
</oasis:row>
<oasis:row>
<oasis:entry colname="c1" align="left">65+</oasis:entry>
<oasis:entry colname="c2" align="char" char=".">9</oasis:entry>
<oasis:entry colname="c3" align="char" char=".">2.3</oasis:entry>
</oasis:row>
</oasis:tbody>
</oasis:tgroup>
<oasis:tgroup cols="3">
<oasis:colspec colnum="1" colname="c1" colwidth="*"/>
<oasis:colspec colnum="2" colname="c2" colwidth="*"/>
<oasis:colspec colnum="3" colname="c3" colwidth="*"/>
<oasis:thead>
<oasis:row>
<oasis:entry colname="c1" align="left"><bold>Race</bold></oasis:entry>
<oasis:entry colname="c2" align="center"
>Frequency (<italic>n</italic> = 397)</oasis:entry>
<oasis:entry colname="c3" align="center">Percent</oasis:entry>
</oasis:row>
</oasis:thead>
<oasis:tbody>
<oasis:row>
<oasis:entry colname="c1" align="left">Caucasian</oasis:entry>
<oasis:entry colname="c2" align="char" char=".">365</oasis:entry>
<oasis:entry colname="c3" align="char" char=".">91.9</oasis:entry>
</oasis:row>
<oasis:row>
<oasis:entry colname="c1" align="left">African American</oasis:entry>
<oasis:entry colname="c2" align="char" char=".">4</oasis:entry>
<oasis:entry colname="c3" align="char" char=".">1.0</oasis:entry>
</oasis:row>
<oasis:row>
<oasis:entry colname="c1" align="left">Hispanic</oasis:entry>
<oasis:entry colname="c2" align="char" char=".">12</oasis:entry>
<oasis:entry colname="c3" align="char" char=".">3.0</oasis:entry>
</oasis:row>
<oasis:row>
<oasis:entry colname="c1" align="left">Asian</oasis:entry>
<oasis:entry colname="c2" align="char" char=".">8</oasis:entry>
<oasis:entry colname="c3" align="char" char=".">2.0</oasis:entry>
</oasis:row>
<oasis:row>
<oasis:entry colname="c1" align="left">Other</oasis:entry>
<oasis:entry colname="c2" align="char" char=".">8</oasis:entry>
<oasis:entry colname="c3" align="char" char=".">2.0</oasis:entry>
</oasis:row>
</oasis:tbody>
</oasis:tgroup>
</oasis:table>
</table-wrap>